Recently at eXact lab a Client approached us because its software was running too slow for its industrial application, and the deadline for a major release was quickly approaching. Could we analyze its system, find the bottleneck and speed it up it in time?
The system, written in several different languages, is structured in a couple dozens microservices. Some services execute CPU and GPU intensive data processing routines., making it akin to high performance computing workloads (which is, incidentally, our expertise!). Around the core workload lie a plethora of ancillary services whose role is to fetch data and pipe it efficiently to the processing applications. Even though it was not our main concern, we did have to consider their potential impact on the general system, for instance by means of keeping disk IO hostage for long periods of time.
But how can we tell where the problem lies on among scores of different services spread over many containers? And how do we isolate processes the belong to the system under investigation from everything else that goes on on the same machine? An additional difficulty is that we cannot reproduce the production workloads in isolation: the problem needs be solved on that.
Profiling microservices
It was evident that we needed to collect data in order to identify the bottleneck, and time was a very limited commodity. After some initial runs with standard tools such as top, ps and the like and considering several existing less-standard tools, we decided that this was one of those rare cases in which it was just quicker to cook up an ad hoc solution.
We needed to be able to collect profiles for all the services within the Client’s system, and to be able to save the data for further analysis and plotting. As tweaking parameters often required a rebuild and restart, container hashes may change quite often, so looking at cgroups would be sub-optimal.
We ended up with a simple Python script that allows filtering all and only the containers belonging to a specific docker compose and inspecting the process ID (PID) of the entrypoint. By use of the psutil library we were then able to sample the metrics of interest, such as CPU and memory usage.
As a final touch, to ease our work on a remote machine, we cooked up a quick dashboard with dash to plot the data and view them on any browser that can reach the machine via http.
Introducing cmon
We are today releasing cmon, the container monitor, for everyone to freely use. We certainly recognize that it is a simple script cooked up in an hour or two, but we nevertheless found it useful and hope it will be just as useful for you.
Once installed as explained in the README, simply run it with no arguments to collect metrics on all running containers or, alternatively, passing -c <compose_label> to only include in the measurement containers belonging to the Compose provided. When you’re done, just CTRL-C out of it and cmon will save the measurements in an HDF5 file (by default the output filename is the current timestamp, but you can override it with -o).
Epilogue
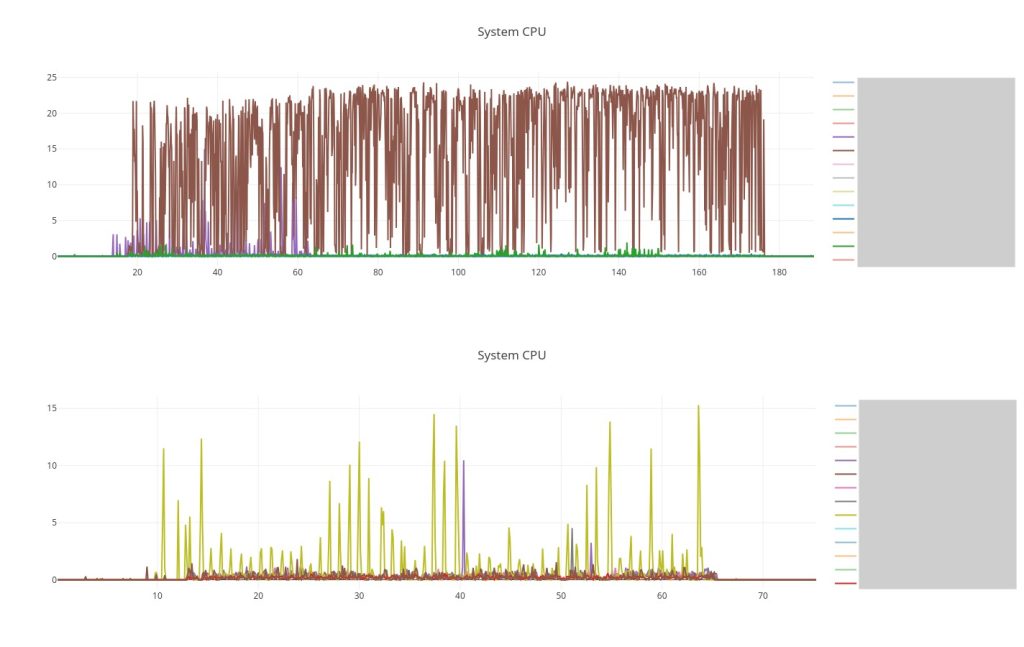
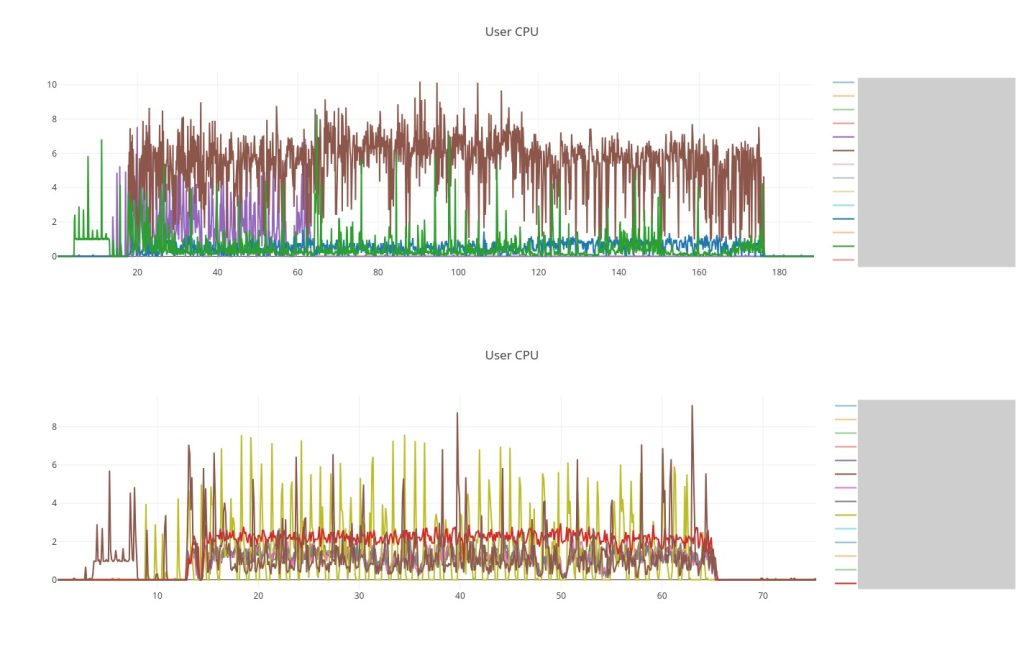
So how did it go with our Client? The following two plots extracted from cmon dashboard say it all! Thanks to cmon we quickly identified the hungriest service and quickly found the root cause of the issue and fixed it. The resource usage has dropped, thus allowing the service to run within the time budget allowed.
The Client was satisfied and could proceeded to releasign the new version of their product. Yet another success story for eXact lab!


Looking forward to work with you
eXact lab is looking forward to have you in our portfolio of satisfied Clients. We have a decade long experience in high performance computing both on the software and on the operation side, as well as proven expertise in providing tailor made data management solutions. Contact us at info@exact-lab.it.
Acknowledgements
We thank our client for clearing the publication of the present case study.

